Northern Hemisphere
Live NOAA aurora forecast map
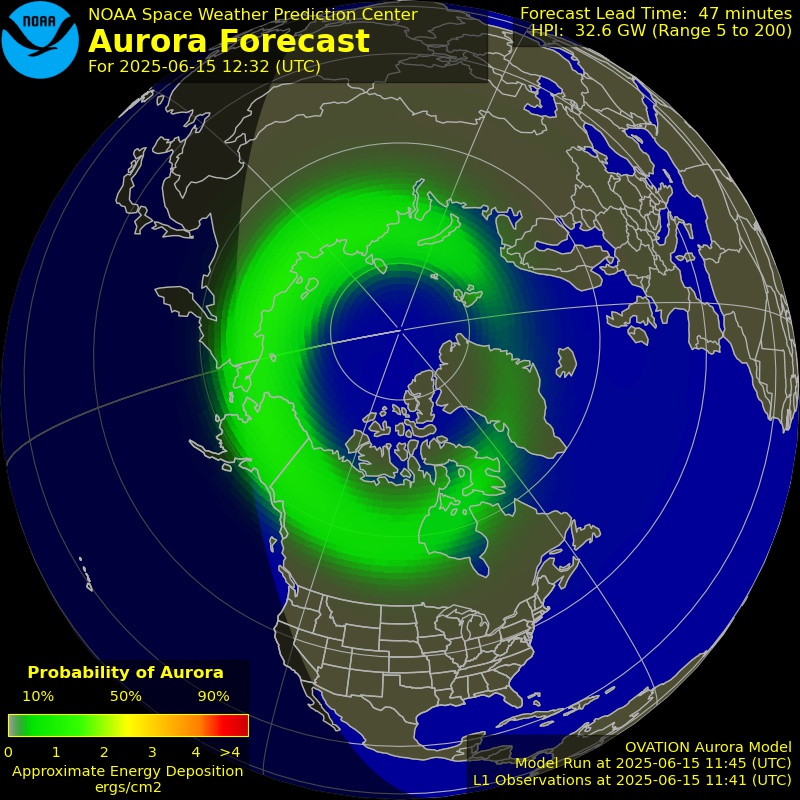
Rendering NOAA’s latest northern hemisphere image.
NOAA-powered northern lights signal
Watch the latest north-pole aurora map, scan fast regional signals for Iceland through Scotland, and read NOAA’s OVATION forecast without digging through a government interface.
Northern Hemisphere
Rendering NOAA’s latest northern hemisphere image.
Regional Quick Look
These cards summarize the current north-side signal near common aurora viewing destinations. Stronger cards mean the oval is pressing farther south or intensifying near that region.
Loading live regional signals…
Regional scores are derived from nearby NOAA OVATION grid cells and translated into plain-language watch levels for quicker scanning.
How To Read It
The closer the bright oval pushes toward your latitude, the better your chance of seeing the aurora.
The aurora is not visible in daylight, even during strong activity. Local sunset and true darkness matter.
Cloud cover can erase a promising forecast. Check local weather before you travel or drive north.
The forecast lead reflects solar-wind travel time from L1 to Earth, so conditions can shift quickly.
Southern Hemisphere
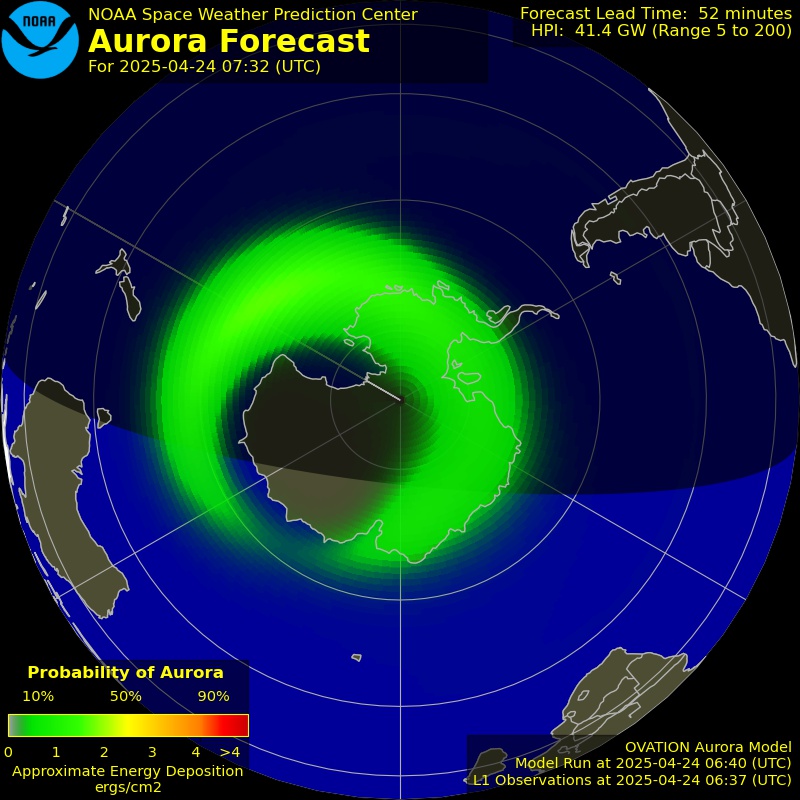
Aurora borealis is the main focus here, but the same NOAA feed also provides a live southern hemisphere view for anyone tracking aurora australis conditions.
Rendering NOAA’s latest southern hemisphere image.
FAQ
It reads NOAA SWPC’s current aurora products directly in the browser. This site adds branding, regional summaries, and a more readable layout on top of the official feed.
Local light pollution, cloud cover, moonlight, and being south of the active oval can all reduce or erase visibility even when the signal looks active on the map.
Each card samples nearby points from NOAA’s OVATION aurora grid and converts that signal into a plain language watch level for quick scanning.